Census ACS 5-Year · 52 states
Most Populated States
Population varies enormously across the United States. The largest states contain sprawling metropolitan areas with tens of millions of residents, while the smallest are home to fewer people than many individual cities. California alone accounts for roughly 12% of the nation's total population, while the six least-populated states combined have fewer residents than the city of Los Angeles. These differences shape everything from congressional representation and Electoral College votes to federal funding allocations. States with rapidly growing populations, particularly in the Sun Belt, are gaining political influence and economic clout at the expense of slower-growing Rust Belt and Northeastern states. Understanding population distribution is fundamental to demographic analysis, urban planning, and public policy.
Key Findings
- 1California leads with a population of 39,242,785, followed by Texas (29,640,343) and Florida (21,928,881).
- 2Wyoming ranks last at 579,761, while California leads at 39,242,785.
- 3The national median across all states is 4,238,714 (Oregon at the midpoint).
- 4The top 10 states are: California, Texas, Florida, New York, Pennsylvania, Illinois, Ohio, Georgia, North Carolina, Michigan.
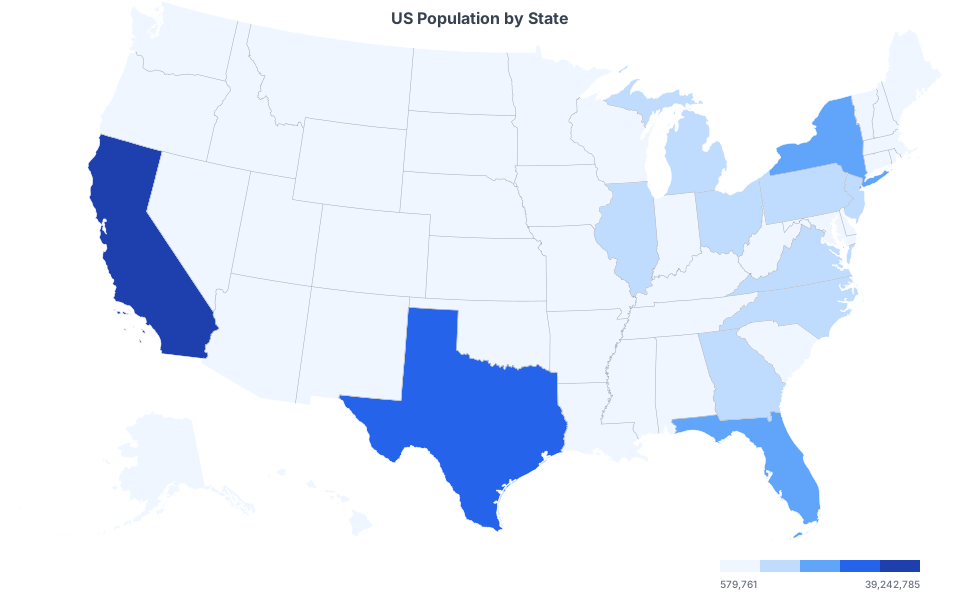
Full Ranking: Most Populated States
Source: Census ACS 5-Year Estimates
| # | State | Population | Median Age | Median Income |
|---|---|---|---|---|
| 1 | Wyoming | 579,761 | 38.8 | $74,815 |
| 2 | Wisconsin | 5,892,023 | 40.1 | $75,670 |
| 3 | West Virginia | 1,784,462 | 42.7 | $57,917 |
| 4 | Washington | 7,740,984 | 38.2 | $94,952 |
| 5 | Virginia | 8,657,499 | 38.8 | $90,974 |
| 6 | Vermont | 645,254 | 43 | $78,024 |
| 7 | Utah | 3,331,187 | 31.7 | $91,750 |
| 8 | Texas | 29,640,343 | 35.5 | $76,292 |
| 9 | Tennessee | 6,986,082 | 38.9 | $67,097 |
| 10 | South Dakota | 899,194 | 37.7 | $72,421 |
| 11 | South Carolina | 5,212,774 | 40.1 | $66,818 |
| 12 | Rhode Island | 1,095,371 | 40.5 | $86,372 |
| 13 | Puerto Rico | 3,254,885 | 44.2 | $25,096 |
| 14 | Pennsylvania | 12,986,518 | 40.9 | $76,081 |
| 15 | Oregon | 4,238,714 | 40.1 | $80,426 |
| 16 | Oklahoma | 3,995,260 | 36.9 | $63,603 |
| 17 | Ohio | 11,780,046 | 39.6 | $69,680 |
| 18 | North Dakota | 779,361 | 35.7 | $75,949 |
| 19 | North Carolina | 10,584,340 | 39.1 | $69,904 |
| 20 | New York | 19,872,319 | 39.6 | $84,578 |
| 21 | New Mexico | 2,114,768 | 39.2 | $62,125 |
| 22 | New Jersey | 9,267,014 | 40.1 | $101,050 |
| 23 | New Hampshire | 1,387,834 | 43.2 | $95,628 |
| 24 | Nevada | 3,141,000 | 38.9 | $75,561 |
| 25 | Nebraska | 1,965,926 | 37.1 | $74,985 |
| 26 | Montana | 1,105,072 | 40.2 | $69,922 |
| 27 | Missouri | 6,168,181 | 38.9 | $68,920 |
| 28 | Mississippi | 2,951,438 | 38.4 | $54,915 |
| 29 | Minnesota | 5,713,716 | 38.6 | $87,556 |
| 30 | Michigan | 10,051,595 | 40.1 | $71,149 |
| 31 | Massachusetts | 6,992,395 | 40 | $101,341 |
| 32 | Maryland | 6,170,738 | 39.3 | $101,652 |
| 33 | Maine | 1,377,400 | 44.8 | $71,773 |
| 34 | Louisiana | 4,621,025 | 37.8 | $60,023 |
| 35 | Kentucky | 4,510,725 | 39.1 | $62,417 |
| 36 | Kansas | 2,937,569 | 37.2 | $72,639 |
| 37 | Iowa | 3,195,937 | 38.6 | $73,147 |
| 38 | Indiana | 6,811,752 | 38 | $70,051 |
| 39 | Illinois | 12,692,653 | 38.9 | $81,702 |
| 40 | Idaho | 1,893,296 | 37.1 | $74,636 |
| 41 | Hawaii | 1,445,635 | 40.6 | $98,317 |
| 42 | Georgia | 10,822,590 | 37.4 | $74,664 |
| 43 | Florida | 21,928,881 | 42.6 | $71,711 |
| 44 | District of Columbia | 672,079 | 34.9 | $106,287 |
| 45 | Delaware | 1,005,872 | 41.5 | $82,855 |
| 46 | Connecticut | 3,598,348 | 41.2 | $93,760 |
| 47 | Colorado | 5,810,774 | 37.5 | $92,470 |
| 48 | California | 39,242,785 | 37.6 | $96,334 |
| 49 | Arkansas | 3,032,651 | 38.4 | $58,773 |
| 50 | Arizona | 7,268,175 | 38.8 | $76,872 |
| 51 | Alaska | 733,971 | 35.6 | $89,336 |
| 52 | Alabama | 5,054,253 | 39.3 | $62,027 |
Methodology
Rankings are based on American Community Survey (ACS) 5-Year estimates from the US Census Bureau. All 50 states and the District of Columbia are included. The ACS surveys approximately 3.5 million households annually and provides detailed demographic, social, economic, and housing data. 5-Year estimates offer the most reliable data for state-level comparisons by averaging responses over a 60-month period. Percentages may not sum to 100% due to rounding.
More Population Rankings
Explore Other Rankings
Related Rankings & Top Entities
Frequently Asked Questions
California has the highest population at 39,242,785, according to latest Census ACS data. Texas and Florida round out the top three.
Wyoming has the lowest population at 579,761. Vermont is second-lowest at 645,254.
The median across all 52 states is 4,238,714. Note that the national median and the state-level median are calculated differently, the state median represents the midpoint when all states are ranked.
This data comes from the American Community Survey (ACS) 5-Year estimates published by the US Census Bureau. The ACS surveys approximately 3.5 million households annually and provides the most comprehensive demographic data available between decennial censuses.
Rankings are based on the latest available Census ACS 5-Year estimates. The Census Bureau releases new ACS data annually. Our data was last updated on April 12, 2026.
Rankings are based on American Community Survey (ACS) 5-Year estimates from the US Census Bureau. All 50 states and the District of Columbia are included. The ACS surveys approximately 3.5 million households annually and provides detailed demographic, social, economic, and housing data. 5-Year estimates offer the most reliable data for state-level comparisons by averaging responses over a 60-month period. Percentages may not sum to 100% due to rounding.
Source: U.S. Census Bureau ACS, 2026.