Census ACS 5-Year · 52 states
States With Highest Median Household Income
Median household income is one of the most important measures of economic well-being. It represents the midpoint of all household incomes in a state, half of households earn more and half earn less, making it more representative than the average, which can be skewed by extremely high earners. Maryland, Massachusetts, and New Jersey consistently rank at the top, benefiting from proximity to major employment centers like Washington DC, Boston, and New York City, as well as high concentrations of college-educated workers in professional and technical fields. The income gap between the richest and poorest states is substantial, often exceeding $35,000 per year. However, raw income numbers don't account for cost of living, a dollar goes much further in Mississippi than in Massachusetts. That said, high-income states generally offer better healthcare access, school quality, and public infrastructure.
Key Findings
- 1District of Columbia leads with a median household income of $106,287, followed by Maryland ($101,652) and Massachusetts ($101,341).
- 2Puerto Rico ranks last at $25,096, while District of Columbia leads at $106,287.
- 3The national median across all states is $74,985 (Nebraska at the midpoint).
- 4The top 10 states are: District of Columbia, Maryland, Massachusetts, New Jersey, Hawaii, California, New Hampshire, Washington, Connecticut, Colorado.
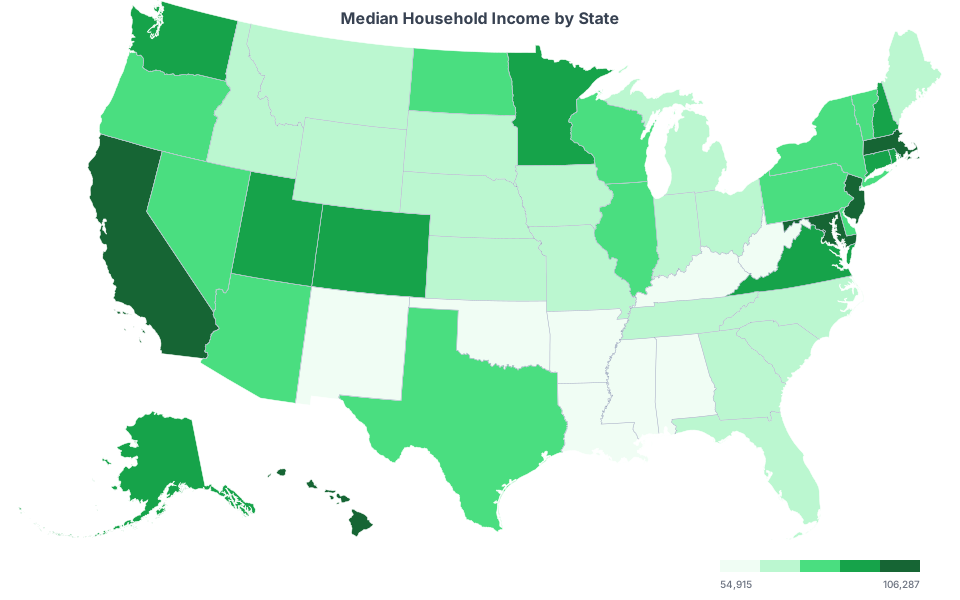
Full Ranking: States With Highest Median Household Income
Source: Census ACS 5-Year Estimates
| # | State | Median Income | Per Capita Income | Poverty Rate |
|---|---|---|---|---|
| 1 | Wyoming | $74,815 | $41,006 | 7.1% |
| 2 | Wisconsin | $75,670 | $42,019 | 6.6% |
| 3 | West Virginia | $57,917 | $32,949 | 11.9% |
| 4 | Washington | $94,952 | $51,493 | 6.4% |
| 5 | Virginia | $90,974 | $49,217 | 6.8% |
| 6 | Vermont | $78,024 | $44,365 | 5.7% |
| 7 | Utah | $91,750 | $39,240 | 5.7% |
| 8 | Texas | $76,292 | $39,446 | 10.5% |
| 9 | Tennessee | $67,097 | $37,866 | 9.9% |
| 10 | South Dakota | $72,421 | $38,880 | 7.4% |
| 11 | South Carolina | $66,818 | $37,993 | 10.1% |
| 12 | Rhode Island | $86,372 | $45,919 | 7.0% |
| 13 | Puerto Rico | $25,096 | $16,794 | 38.2% |
| 14 | Pennsylvania | $76,081 | $43,104 | 8.1% |
| 15 | Oregon | $80,426 | $44,063 | 7.3% |
| 16 | Oklahoma | $63,603 | $34,859 | 11.1% |
| 17 | Ohio | $69,680 | $39,455 | 9.2% |
| 18 | North Dakota | $75,949 | $42,474 | 6.2% |
| 19 | North Carolina | $69,904 | $39,616 | 9.4% |
| 20 | New York | $84,578 | $49,520 | 9.8% |
| 21 | New Mexico | $62,125 | $34,823 | 13.7% |
| 22 | New Jersey | $101,050 | $53,118 | 7.0% |
| 23 | New Hampshire | $95,628 | $50,867 | 4.4% |
| 24 | Nevada | $75,561 | $39,963 | 9.0% |
| 25 | Nebraska | $74,985 | $40,637 | 6.7% |
| 26 | Montana | $69,922 | $39,842 | 7.1% |
| 27 | Missouri | $68,920 | $38,497 | 8.4% |
| 28 | Mississippi | $54,915 | $30,529 | 14.3% |
| 29 | Minnesota | $87,556 | $46,957 | 5.5% |
| 30 | Michigan | $71,149 | $39,538 | 8.8% |
| 31 | Massachusetts | $101,341 | $56,284 | 6.6% |
| 32 | Maryland | $101,652 | $51,689 | 6.3% |
| 33 | Maine | $71,773 | $42,035 | 6.5% |
| 34 | Louisiana | $60,023 | $34,211 | 14.2% |
| 35 | Kentucky | $62,417 | $34,960 | 11.8% |
| 36 | Kansas | $72,639 | $39,638 | 7.7% |
| 37 | Iowa | $73,147 | $39,728 | 6.9% |
| 38 | Indiana | $70,051 | $37,178 | 8.4% |
| 39 | Illinois | $81,702 | $45,104 | 8.2% |
| 40 | Idaho | $74,636 | $37,169 | 7.0% |
| 41 | Hawaii | $98,317 | $44,823 | 6.9% |
| 42 | Georgia | $74,664 | $39,525 | 9.9% |
| 43 | Florida | $71,711 | $41,055 | 8.9% |
| 44 | District of Columbia | $106,287 | $75,253 | 10.7% |
| 45 | Delaware | $82,855 | $44,219 | 7.3% |
| 46 | Connecticut | $93,760 | $54,409 | 6.8% |
| 47 | Colorado | $92,470 | $50,489 | 5.9% |
| 48 | California | $96,334 | $47,977 | 8.4% |
| 49 | Arkansas | $58,773 | $33,147 | 11.5% |
| 50 | Arizona | $76,872 | $40,736 | 8.9% |
| 51 | Alaska | $89,336 | $44,928 | 6.8% |
| 52 | Alabama | $62,027 | $34,835 | 11.3% |
Methodology
Rankings are based on American Community Survey (ACS) 5-Year estimates from the US Census Bureau. All 50 states and the District of Columbia are included. The ACS surveys approximately 3.5 million households annually and provides detailed demographic, social, economic, and housing data. 5-Year estimates offer the most reliable data for state-level comparisons by averaging responses over a 60-month period. Percentages may not sum to 100% due to rounding.
More Economy Rankings
Explore Other Rankings
Related Rankings & Top Entities
Ranked #1 by median household income
Ranked #2 by median household income
Ranked #3 by median household income
More economy rankings
More economy rankings
More economy rankings
Frequently Asked Questions
District of Columbia has the highest median household income at $106,287, according to latest Census ACS data. Maryland and Massachusetts round out the top three.
Puerto Rico has the lowest median household income at $25,096. Mississippi is second-lowest at $54,915.
The median across all 52 states is $74,985. Note that the national median and the state-level median are calculated differently, the state median represents the midpoint when all states are ranked.
This data comes from the American Community Survey (ACS) 5-Year estimates published by the US Census Bureau. The ACS surveys approximately 3.5 million households annually and provides the most comprehensive demographic data available between decennial censuses.
Rankings are based on the latest available Census ACS 5-Year estimates. The Census Bureau releases new ACS data annually. Our data was last updated on April 12, 2026.
Rankings are based on American Community Survey (ACS) 5-Year estimates from the US Census Bureau. All 50 states and the District of Columbia are included. The ACS surveys approximately 3.5 million households annually and provides detailed demographic, social, economic, and housing data. 5-Year estimates offer the most reliable data for state-level comparisons by averaging responses over a 60-month period. Percentages may not sum to 100% due to rounding.
Source: U.S. Census Bureau ACS, 2026.