Census ACS 5-Year · 52 states
States With Highest Median Home Values
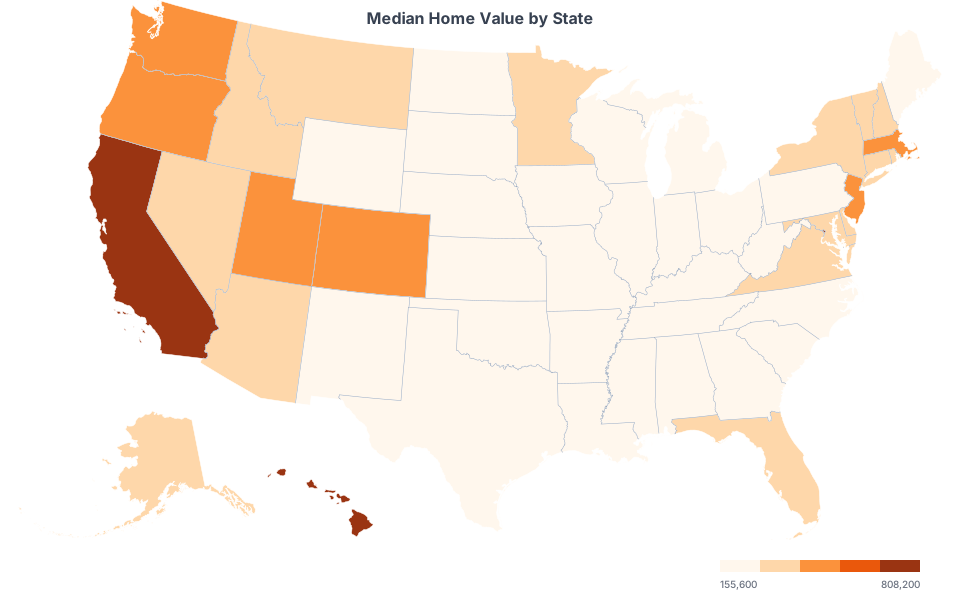
Home values are one of the most closely watched economic indicators, reflecting both local economic strength and the broader supply-demand dynamics of housing markets. Hawaii, California, and Massachusetts consistently have the highest median home values, driven by geographic constraints on new construction, strong job markets, and desirable climates. Coastal states dominate the top of this ranking because land is scarce and building regulations are typically more restrictive. High home values are a double-edged sword: homeowners benefit from wealth accumulation, but first-time buyers and renters face severe affordability challenges. The gap between the most and least expensive states is dramatic, often a 5-to-1 ratio or more. Housing affordability has become a defining economic issue, affecting migration patterns as workers and families relocate from expensive coastal states to more affordable alternatives in the South and Mountain West.
Key Findings
- 1Hawaii leads with a median home value of $808,200, followed by District of Columbia ($724,600) and California ($695,400).
- 2Puerto Rico ranks last at $124,600, while Hawaii leads at $808,200.
- 3The national median across all states is $266,400 (Maine at the midpoint).
- 4The top 10 states are: Hawaii, District of Columbia, California, Massachusetts, Washington, Colorado, Utah, Oregon, New Jersey, Nevada.
Full Ranking: States With Highest Median Home Values
Source: Census ACS 5-Year Estimates
| # | State | Median Home Value | Median Rent | Homeownership |
|---|---|---|---|---|
| 1 | Wyoming | $285,100 | $968.00 | 71.9% |
| 2 | Wisconsin | $247,400 | $1,045 | 67.9% |
| 3 | West Virginia | $155,600 | $850.00 | 74.3% |
| 4 | Washington | $519,800 | $1,682 | 63.9% |
| 5 | Virginia | $360,700 | $1,514 | 67.2% |
| 6 | Vermont | $290,500 | $1,193 | 72.8% |
| 7 | Utah | $455,000 | $1,405 | 70.6% |
| 8 | Texas | $260,400 | $1,339 | 62.6% |
| 9 | Tennessee | $256,800 | $1,122 | 67.0% |
| 10 | South Dakota | $236,800 | $912.00 | 68.6% |
| 11 | South Carolina | $236,700 | $1,126 | 71.4% |
| 12 | Rhode Island | $368,800 | $1,273 | 63.3% |
| 13 | Puerto Rico | $124,600 | $562.00 | 68.1% |
| 14 | Pennsylvania | $240,500 | $1,162 | 69.3% |
| 15 | Oregon | $454,200 | $1,450 | 63.4% |
| 16 | Oklahoma | $185,900 | $980.00 | 65.8% |
| 17 | Ohio | $199,200 | $988.00 | 67.0% |
| 18 | North Dakota | $241,100 | $934.00 | 63.4% |
| 19 | North Carolina | $259,400 | $1,162 | 66.4% |
| 20 | New York | $403,000 | $1,576 | 54.3% |
| 21 | New Mexico | $232,200 | $1,021 | 69.3% |
| 22 | New Jersey | $427,600 | $1,653 | 63.7% |
| 23 | New Hampshire | $367,200 | $1,423 | 72.5% |
| 24 | Nevada | $406,100 | $1,489 | 59.3% |
| 25 | Nebraska | $223,800 | $1,035 | 66.5% |
| 26 | Montana | $338,100 | $1,031 | 69.4% |
| 27 | Missouri | $215,600 | $996.00 | 67.9% |
| 28 | Mississippi | $161,400 | $923.00 | 69.5% |
| 29 | Minnesota | $305,500 | $1,235 | 72.4% |
| 30 | Michigan | $217,600 | $1,084 | 72.9% |
| 31 | Massachusetts | $525,800 | $1,687 | 62.6% |
| 32 | Maryland | $397,700 | $1,662 | 67.5% |
| 33 | Maine | $266,400 | $1,084 | 74.0% |
| 34 | Louisiana | $208,700 | $1,038 | 67.3% |
| 35 | Kentucky | $192,300 | $933.00 | 68.3% |
| 36 | Kansas | $203,400 | $1,029 | 66.9% |
| 37 | Iowa | $195,900 | $949.00 | 71.5% |
| 38 | Indiana | $201,600 | $1,020 | 70.4% |
| 39 | Illinois | $250,500 | $1,227 | 66.8% |
| 40 | Idaho | $376,000 | $1,150 | 72.4% |
| 41 | Hawaii | $808,200 | $1,938 | 62.6% |
| 42 | Georgia | $272,900 | $1,306 | 65.4% |
| 43 | Florida | $325,000 | $1,564 | 67.3% |
| 44 | District of Columbia | $724,600 | $1,900 | 41.1% |
| 45 | Delaware | $326,800 | $1,341 | 72.3% |
| 46 | Connecticut | $343,200 | $1,431 | 66.2% |
| 47 | Colorado | $502,200 | $1,693 | 66.3% |
| 48 | California | $695,400 | $1,956 | 55.8% |
| 49 | Arkansas | $175,300 | $914.00 | 66.1% |
| 50 | Arizona | $358,900 | $1,431 | 67.0% |
| 51 | Alaska | $333,300 | $1,388 | 66.6% |
| 52 | Alabama | $195,100 | $963.00 | 69.9% |
Methodology
Rankings are based on American Community Survey (ACS) 5-Year estimates from the US Census Bureau. All 50 states and the District of Columbia are included. The ACS surveys approximately 3.5 million households annually and provides detailed demographic, social, economic, and housing data. 5-Year estimates offer the most reliable data for state-level comparisons by averaging responses over a 60-month period. Percentages may not sum to 100% due to rounding.
More Housing Rankings
Explore Other Rankings
Related Rankings & Top Entities
Frequently Asked Questions
Hawaii has the highest median home value at $808,200, according to latest Census ACS data. District of Columbia and California round out the top three.
Puerto Rico has the lowest median home value at $124,600. West Virginia is second-lowest at $155,600.
The median across all 52 states is $266,400. Note that the national median and the state-level median are calculated differently, the state median represents the midpoint when all states are ranked.
This data comes from the American Community Survey (ACS) 5-Year estimates published by the US Census Bureau. The ACS surveys approximately 3.5 million households annually and provides the most comprehensive demographic data available between decennial censuses.
Rankings are based on the latest available Census ACS 5-Year estimates. The Census Bureau releases new ACS data annually. Our data was last updated on April 12, 2026.
Rankings are based on American Community Survey (ACS) 5-Year estimates from the US Census Bureau. All 50 states and the District of Columbia are included. The ACS surveys approximately 3.5 million households annually and provides detailed demographic, social, economic, and housing data. 5-Year estimates offer the most reliable data for state-level comparisons by averaging responses over a 60-month period. Percentages may not sum to 100% due to rounding.
Source: U.S. Census Bureau ACS, 2026.